Readings |
Assignments |
| Before Class install Tableau Desktop |
Presentations
Dave Geoghegan, Serial Entrepreneur
Chief Technology Officer of Channel Eyes
Introduction to Visualization Lab 6
Getting Started
For this lab we will begin the process of learning visualization through the See Click Fix Kaggle Project. Go ahead and download the train file from the Kaggle Website.
The first part of any data visualization project is data understanding. Start with the process of understanding the data fields and the context of the data.
(1). IN YOUR OWN WORDS, describe what the data involves and key fields that are identified.
Import the Data. You should be able to do this using the instructions from class and the video.
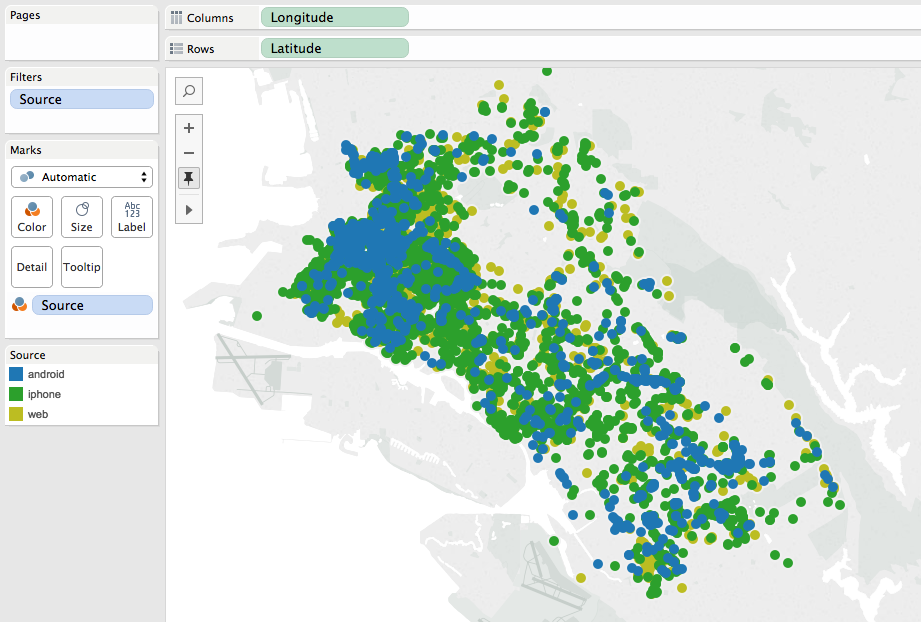
We want to get started with identifying the data on a map. Drag the Longitude to the column and the Latitude to the rows.
Filter the Data. We have 4 cities here but we only want one of them. We need to create a filter that selects based on the longitude/latitude.
(2). IN YOUR OWN WORDS, describe the filter you created to select only one city.
Change the type to a Map. Select on the Show Me map to show your city on a map. (This actually happens automatically).
Tag Type. Drag the tags over to the colors and select filter and add. Select just a few tags.
Understand Tags. Create a new worksheet and drag Tag Type from the dimensions and create a visualization that is sorted by the count of the number of tags. For example, something like the following could work:
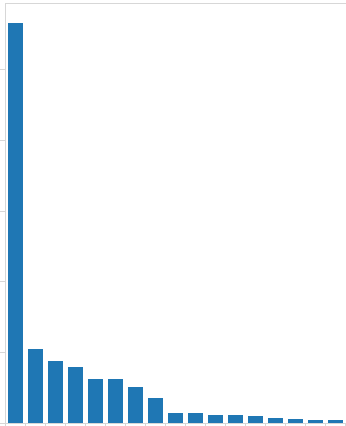
(3). Provide an image showing the 5 most frequent tag types.
(4). Create 4 visualizations that help you to understand more details about the data or make a specific point. At least one should use the Map. Provide 1-3 sentences.
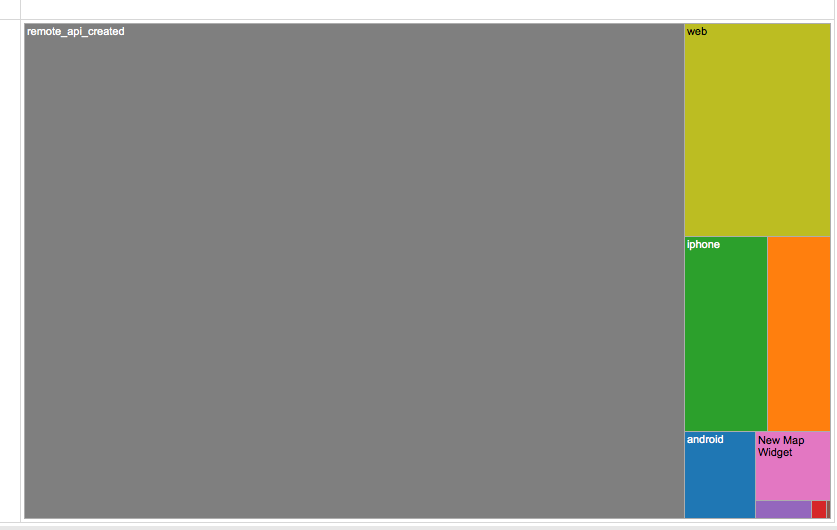
For example, this image below gives you a broad understand that the majority of the records come from the remote_api_created category.
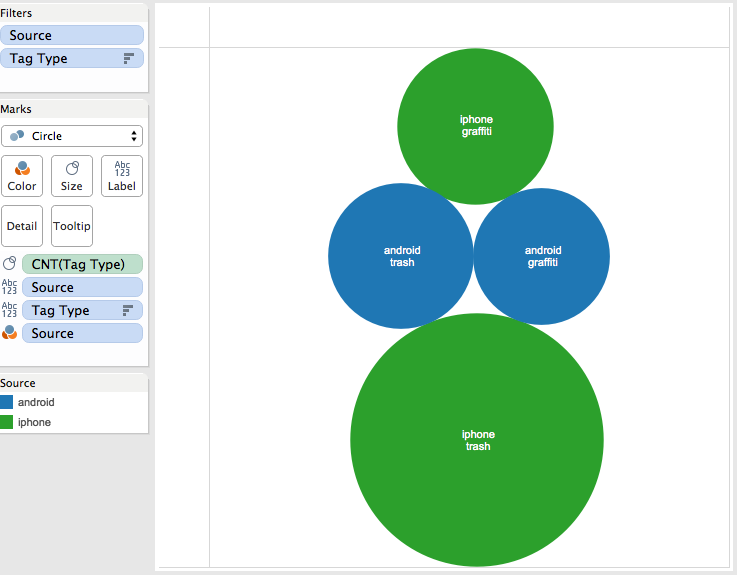
In another example, here we can see that relative to Android users, iPhone users care a lot more about trash than Graffiti while Android users care approximately the same for each. The visualization filters out others to tell a specific story.
This shows that Android users seem to be located more densely in the northern part of the city.
(5) Create a new dashboard and add the 4 different visualizations to the dataset. Paste the final image with all 4 below.
Header photo created on Tableau by Jason Kuruzovich.