Subsetting, Merging, and Aggregating Data in R and Python
Subsetting Data
Subsetting data, merging data, and aggregating data are each extremely useful techniques that are critical to analyzing data.
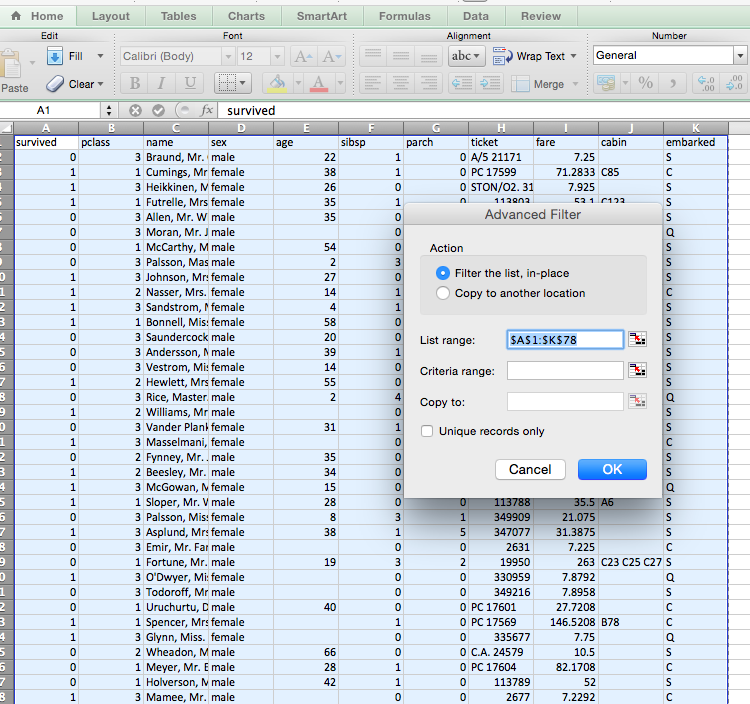
Subsetting or filtering data requires a dataset and a criteria under which to filter this data. You can see this process in excel conceptually.
When subset data, there can be a number of different conceptual reasons that we would want to do this. Here are a few:
* Selection the population of interest. Many times we want to understand the properties of a specific group. Let’s say we are working on a baseball dataset and we only want to understand some general statistics associated with one particular position such as a pitcher. We may as a first part of the analysis do a subset or a filter.
* Splitting data between testing and training datasets. When we get into the modeling of a dataset, we need to provide different sets of data to train our algorithm and a completely separate set to test the validity of the predictions. We will cover this issue of overfitting in detail in future classes.
* Calculations and feature creation. Often there are additional variables (in analyses we will call these features) that we would like to create. One common model of doing calculations is to first subset the values that you would like to calculate. This is often called the split-apply-combine process.
When we select data, there are two different strategies that are worthwhile talking about from a conceptual level. Let’s consider a case in which we want to select only certain rows from a dataset. There are 2 different ways that you can can subset the data from the data frame:
* Selection vector with list of desired rows. In this case we generate a vector which contains the desired rows of the dataset. The vector will have a length equal to the subset.
* Boolean vector where true for desired rows. In this case we generate a boolean vector with a value of true for the rows we want. The vector will be of the same length of the initial data.
Merging Data
When we are merging data, we need some type of a key in order to be able to link the data. Most frequently we will have some type of key in order to uniquely identify an entity in one dataset with another. This is a common value in both datasets. Ideally this will be some type of unique integer, but you may have times where you will have to match text strings or even create models to do the matching! We won’t worry about these more complex situations now though.
We have a number of different possibilities, regarding what we want for the outcome if we are connecting two datasets A and B. These correspond directly to the following types of joins:
- Inner Join. The outcome file should only have a row where there is a match between only keys where A = B.
- Left Outer Join. All records from A (even if no match) and only records from B where there is a match.
- Right Outer Join. All records from B (even if no match) and only records from A where there is a match.
Full Outer. All records from A & B (even if no match).
Aggregating Data
In many cases you will want to understand the level of analysis of your study. Consider a baseball team. Are you interested in understanding an outcome that is an attribute of a player, a team, or a division (a group of teams). Moving from players to teams means that you have to aggregate data. When you are aggregating data, it is most common to either take the mean or the sum across a variable. Whether it is most appropriate to take the mean or average relies on your business understanding of the data. Conceptually, which is likely to be more meaningful?
In other cases, aggregation of data may be necessary to incorporate the time variable into the analysis. Consider you would like to understand some metric in quarterly earnings and whether it has some type of relationship to stock price. You may be able to get stock price on a second by second basis, but does that help you? Even if you obtain this data your are likely to aggregate the data using some method that links it with the quarterly data. For example you could average the stock price for the 5 days following the quarterly announcements.
Exercises
I’ve provided separate R-Markdown and iPython notebooks to examine the data in each case.
R-Markdown HTML
R-Markdown Download
Help on Lab
Getting CSV Files into RStudio
If your are having trouble getting file into RStudio, here are some options.
OPTION 1
If sharing is working between the guest virual machine and the host, the easiest way is to sync your Git repository and then load the data from the shared drive. Look at the repository directory.
setwd('/vagrant/data')
list.files()
titantic <- read.csv('titantic_train.csv', header = TRUE )
OPTION 2
You can import a dataframe from github directly using the gui with import dataset->from web url.
https://raw.githubusercontent.com/RPI-Analytics/MGMT6963-2015/master/data/titantic_train.csv
Note. During the import process on the top left you can specify the dataframe name. By default it will come through as titantic_train. You can create a new one called titantic using the code below.
titantic<-titantic_train
OPTION 3
R doesen’t seem to have a real robust method of dealing with files and https, which I have seen cause some problems.
Instead, you can vagrant ssh into the /home/vagrant directory of the virtual machine this is default. Then enter wget https://raw.githubusercontent.com/RPI-Analytics/MGMT6963-2015/master/data/titantic_train.csv from the terminal. This will download the file directly to the linux virtual machine.
#You only need to set working directory if you changed the working directory to something else. This is default.

setwd('/home/vagrant')
list.files()
titantic <- read.csv('titantic_train.csv', header = TRUE )
Header photo public domain picture retrieved from here