Readings |
Assignments |
There are no readings for today. |
There is no assignment for today. |
Presentation
The Rise of Analytics
“There were 5 exabytes of information created between the dawn of civilization through 2003, but that much information is now created every 2 days.” – Eric Schmidt
Eric Schmidt’s often repeated quote might not be verifiable in calculation, but the overall sentiment of it rings true to anyone who follows data associated with the web and computing. We are bursting in data, with systems and processes generating ever increasing amounts of digital reflections of the world around us. So many parts of our life become embedded in a digital process or involve some aspects of digitization.
When processes become digital, they leave footprints of past decisions and outcomes. They often incorporate new ways of collecting and using data. These footprints provide tremendous possibilities for insight, optimization, and eventual analysis
Consider the case of Disney World. At the at the launch of Disney World, the data footprint of the organization might have been just the number of tickets sold and the total revenue obtained. A centralized reporting for other factors like inventory and product sales would have to be obtained through a complex series of paper aggregations.

With the emergence of digital processing the management team of Disney then had visibility into all the purchases of individuals, seeing clearly inventory and sales. This greatly increases the degree to which systematic analysis can be applied to a business process. For example, managers could identify specific high quality customers, calculate a customer lifetime value, and use that information in marketing. At its essence, data becomes the lens through which management sees the organization and often decisions and management initiatives are carried out by yet more technology.
While this transactional data is extremely powerful, a next wave of radio frequency ID trackers and devices are generating even more data. Magic bands currently connect all touch points of the customer experience, and one could imagine increase use of sensors could provide geolocation data for nearly everyone in the park on an ongoing basis. In terms of management, this ability to increase the granularity can enable new questions. It also increases the complexity of going from data to understanding.

In addition to the trends associated with data and management we see with companies like Disney, there are a number of additional factors driving the explosive growth of data.
-
The Web. As of today (August 11, 2015) The indexed web is approximately 4.75 billion page and is the biggest data store ever constructed, with a wide variety of data that can potentially provide insights into decision making or require direct management by employees. Whether it is the web store pricing of competitors, reviews by consumers, or tweets targeting your brand, if you are in business the web is likely to have some value for you.
-
The Internet of Things. Data now comes from so many of the digitally enabled devices, sensors, apps, and video. As the things around us (thermostats, glasses, refrigerators, scales, watches). An internet enabled scale can now check your weight and body fat percentage and sync it with an only service to help you manage and track your weight over time while your watch tracks your heart rate, activity, and sleeping. GE, traditionally an industrial that manufactures equipment, now gathers 50 million data points from over 10 million installed sensors and is [doubling down on data as a growth area] (http://bits.blogs.nytimes.com/2014/10/09/ge-opens-its-big-data-platform/?_r=0).
-
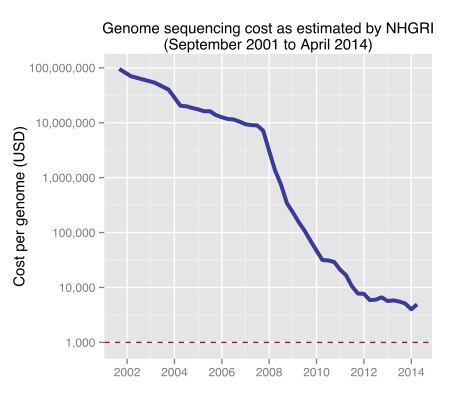
Genetics. The cost of gene sequencing has dropped tremendously, putting into hands of researchers the ability to collect and analyze the sequence of genes. While we aren’t yet to the point where an accepted checkup involves gene sequencing, we aren’t that far off.
How can organizations gain the value from this data? Enter analytics…..
“Analytics is the discovery and communication of meaningful patterns in data.” -Wikipedia
“Information is the oil of the 21st century, and analytics is the combustion engine.” – Peter Sondergaard
The data and a wide variety of analysis methods have been and for a long time. But data analytics and data science have each recently exploded onto the scene as something that nearly any company has had to address their strategy and countless startups have employed.
Organizations made tremendous investments in IT related systems, often with the expectation of better decision making. The majority of initial enterprise (ERP) and CRM systems were just about capturing workflows digitally. With many of these systems in place for years, companies now have the opportunity to move on the decision making using analytics.
How can organizations learn to apply analytics to gain the value from data? Enter the data scientist…..
What do Data Scientists Do?
In order to understand data science, it is important to understand both processes of executing data science as well as what data scientists do in a day-to-day role. Conceptually, the CRISP model of data mining provides a process level overview of what it means to be a data scientist.
THE CRISP PROCESS MODEL

At the foundation of a project, a fundamental business understanding of the desired outcome and the associated data and business process must be obtained. Without the relative contextual factors, it is unlikely that the analyses will yield much meaning. This is especially important in age of tremendous access to data from so many different sources. Business understanding with help specifically with two different things. First, it will help you to filter and formulate the appropriate question. Without the appropriate questions it is difficult to access the appropriate answer. Second, it will enable you to effectively understand the mechanisms involved in why a specific relationship occurs. Analytics is, in the end, a crude technique that in many cases can monitor a specific outcome but not all the steps in-between. Though it is getting much more inclusive of processes, often specific mechanisms of influence are unclear and it is up to the analyst to know when to challenge or explain specific results.
Hacking skills and a lack of foundation business understanding have also be identified as a “danger zone” in Drew Conway’s viral Venn Diagram, which

by Drew Conway from drewconway.com.
I one very unsuccessful research project in which I obtained some rather unique data on technology adoptions and preventable errors in healthcare. The data was extensive and illusive, covering hundreds of adoption of different types of IT systems. I mined the data for a while looking for relationships and not finding any stable results. A few years later I saw a presentation by an individual who had thrown away 90% of the data and looked at those very few dimensions that were useful directly healthcare, found through extensive conversations with doctors and domain experience.
Data understanding goes directly along with business understanding, providing a fundamental understanding of the meaning, structure, quality, and quantity of the data. Consider a simple question at a university: “how many students do we have?” Such a question is linked to both the individual and the context requiring decisions on what it means to be a student. Are part-time students? Some systems the answer would be a definitive yes and other times no. For a classroom allocation clearly the part-time student would still need a seat. However, in other cases important metrics for school rankings may depend only on full time students.
Data Preparation. It is often stated that 80% of the work in an analytics projects comes from the process of preparing the data for analysis. Terms like Data munging and Data Jitsu acknowledge that in the act of getting data ready for analytics is a complex skill that often involves almost an art. We will be spending a lot of time talking about this topic..as that really is the technology fundamentals of business analytics. You need to know how to retrieve, parse, match, clean, filter, aggregate, and integrate data from many different sources and qualities.
Modeling. Modeling is where algorithm meets data, and the result is often beautiful to see. There are models that help to explain relationships and others that help to predict them. While so much of what typical scientists, economists, and statisticians do is in the area of explaining things, in data science we often want predictions. This change in purpose often changes the algorithm and how we apply it to the data.
Evaluation. The structural efforts put in place to ensure correct evaluation of a model are as important as the processes to create the model.
Business Understanding and Deployment What do you do with analytics after evaluating the model? In many cases, it depends on the underlying goal and whether the desire is predictive or explanitory data analysis. Predictive analyses can often be deployed within a business process, changing the model to operational prediction.
We will be going over specific steps in each of these, but what is important do understand about this is that this is the framework that we will use to go through our journey to being a data scientist.
To continue this journey, we will have to develop capabilities across a wide array of concepts, languages, and tools. Some have referred to the data scientist as a “unicorn” because of all of the underlying capabilities required, but I believe that for the individual that likes to learn, this is a great place to be.
As a next step, let’s start the process of working with our data science toolbox.
Photo Credits
#### Cover.
[Cover] (https://commons.wikimedia.org/wiki/File:Internet_map_1024_-_transparent,_inverted.png)
By The Opte Project [CC BY 2.5 (http://creativecommons.org/licenses/by/2.5) or CC BY 2.5 (http://creativecommons.org/licenses/by/2.5)], via Wikimedia Commons
Magic Band
By Julie Friend (Own work) [CC BY-SA 3.0 (http://creativecommons.org/licenses/by-sa/3.0)], via Wikimedia Commons
Genome Sequencing
By Ben Moore (Own work) [CC BY-SA 3.0 (http://creativecommons.org/licenses/by-sa/3.0)], via Wikimedia Commons
[Telescope] (https://commons.wikimedia.org/wiki/File:USA.NM.VeryLargeArray.02.jpg)
By user:Hajor (Own work) [CC BY-SA 2.0 (http://creativecommons.org/licenses/by-sa/2.0), GFDL (http://www.gnu.org/copyleft/fdl.html), CC-BY-SA-3.0 (http://creativecommons.org/licenses/by-sa/3.0/) or GPL (http://www.gnu.org/licenses/gpl.html)], via Wikimedia Commons
CRISPKenneth Jensen